
In Vitro Drug Development
Characterize experimental drug responses, cellular effects and associated molecular changes using cell-based models and targeted gene expression approaches.
Explore in vitro drug development


AnyGenes® provides high-throughput data analysis services for genomic and transcriptomic research, including RNA-seq and other NGS datasets, qPCR array data and gene expression microarrays.
Statistical and bioinformatics approaches can be adapted to the dataset, experimental design and research question to assess data quality, compare experimental groups, identify molecular patterns and prioritize candidates for further investigation.
High-throughput molecular data analysis can complement cell-based drug-response studies, targeted biomarker validation and DNA methylation analysis according to the dataset, biological question and stage of the research project.
Characterize experimental drug responses, cellular effects and associated molecular changes using cell-based models and targeted gene expression approaches.
Explore in vitro drug development
Evaluate candidate biomarkers using targeted qPCR, pathway-focused SignArrays® and customized gene expression panels adapted to your research objectives.
Explore biomarker validation services
Examine DNA methylation and epigenetic regulation using targeted molecular approaches adapted to selected genomic regions and biological questions.
Explore DNA methylation analysis
Analyze genomic and transcriptomic datasets using statistical and bioinformatics approaches adapted to gene expression, molecular patterns and research objectives.
Different molecular technologies generate datasets with distinct structures, quality metrics and analytical requirements. The analysis should therefore reflect the technology, experimental comparisons and biological objective.
Process and analyze sequencing datasets using quality assessment, alignment or mapping when relevant, quantification and comparative bioinformatics approaches defined by the project scope. Primary and secondary NGS analysis can be included according to the data and analytical requirements.
Process targeted gene expression datasets, normalize measurements, compare experimental groups and examine expression patterns across selected genes or biological pathways.
Analyze gene expression microarray datasets using appropriate preprocessing, statistical comparisons and visualization approaches according to the platform and experimental design.
The analytical approach can combine data processing, statistical comparisons, pattern exploration and structured reporting according to the type of dataset and the questions being investigated.
Review dataset quality and apply preprocessing steps appropriate to the technology before downstream statistical or comparative analysis.
Compare experimental groups using statistical approaches selected according to the study design, dataset structure and research objective.
Explore groups of genes or samples with related molecular profiles to identify patterns that may help characterize experimental conditions.
Identify molecular features showing differences between defined experimental groups and prioritize candidates for biological interpretation or targeted follow-up.
When appropriate to the dataset and project objectives, classification algorithms can be considered to explore molecular patterns or distinguish defined experimental groups.
Structure results using tables, statistical summaries and graphical outputs designed to support biological interpretation and communication of the analysis.
A structured analysis can connect dataset review, statistical processing, visualization and biological interpretation while accounting for the characteristics of the platform and study.
Identify the data type, experimental groups, comparisons of interest and biological objectives.
Assess the structure and quality of the dataset and determine the preprocessing steps required for downstream analysis.
Apply analytical approaches suited to the dataset, experimental design and comparisons being investigated.
Generate graphical outputs and identify genes, molecular patterns or candidate features relevant to the research question.
Organize the results for biological interpretation and determine whether additional analysis or targeted experimental follow-up may be useful.
Project-adapted analysis: the sequence of analytical steps may differ between RNA-seq, other NGS datasets, microarrays and qPCR arrays. The workflow should be defined according to the data available and the objectives of the study.
High-throughput genomic and transcriptomic analysis can support different research questions, from gene expression profiling to the characterization of molecular responses and candidate signatures.
Compare expression profiles across experimental groups and examine genes or molecular patterns associated with defined biological conditions.
Analyze RNA-seq, whole-genome sequencing (WGS) or other sequencing datasets using bioinformatics approaches selected according to the type of data and the objectives of the study.
Analyze microbiome-related sequencing datasets when this type of analysis is included within the scope and requirements of the research project.
Investigate molecular changes associated with defined treatment conditions and identify candidate genes or pathways linked to an experimental response.
Compare molecular profiles from experimental models, including genetically modified or otherwise defined biological systems, according to the study design.
Prioritize genes, molecular features or candidate signatures identified through high-throughput analysis for further biological investigation or targeted validation.
High-throughput analysis can identify differential molecular features and expression patterns, and highlight biological pathways associated with the observed changes. Selected findings can then be investigated using focused qPCR approaches.
Use statistical results, expression patterns and biological context to select a focused subset of genes for additional investigation.
Examine whether prioritized genes are associated with selected biological pathways or candidate molecular signatures relevant to the experimental question.
Selected candidates can be examined using validated qPCR primers, pathway-focused SignArrays® or customized gene expression panels.
Depending on the platform and project scope, analysis outputs can include quality metrics, statistical results, gene or sample comparisons, graphical visualizations and structured reports.
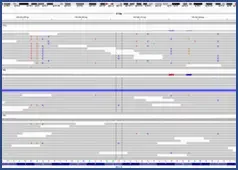
Depending on the project, outputs may include sequencing quality summaries, mapping or quantification results, differential analyses, tables and graphical representations.
Explore RNA-seq data analysis
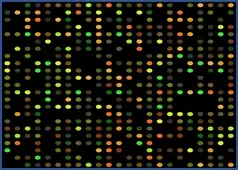
Statistical comparisons and gene expression visualizations can help summarize molecular differences between defined experimental groups.
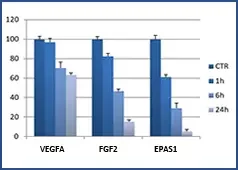
Normalized expression data, comparative results and graphical summaries can support interpretation of targeted gene panels across experimental conditions.
Reporting: the exact outputs depend on the dataset, analytical methods and project scope. Results can be organized into structured tables, figures and analysis reports for downstream interpretation.
Common questions about genomic and transcriptomic datasets, statistical analysis, bioinformatics workflows and targeted experimental follow-up.
High-throughput data analysis services use statistical and bioinformatics approaches to process, compare and interpret molecular datasets generated by technologies such as RNA-seq and other NGS approaches, gene expression microarrays or qPCR arrays. The analytical strategy depends on the platform, dataset structure and research question.
AnyGenes® can work with several types of genomic and transcriptomic datasets, including RNA-seq and other NGS data, qPCR array results and gene expression microarray datasets. The exact analysis should be defined according to the data available and project requirements.
Yes. RNA-seq and other sequencing datasets can be processed using bioinformatics steps adapted to the project, including data quality assessment, quantification, comparative analysis and visualization when relevant to the dataset.
Yes. qPCR array datasets can be normalized and compared across experimental conditions to examine targeted gene expression patterns, selected pathways and candidate molecular responses.
Useful information includes the data type, experimental groups, sample annotations, comparisons of interest and the biological question being investigated. Additional requirements depend on the platform and the analysis requested.
Yes. Candidate genes, pathways or molecular patterns identified through high-throughput analysis can be selected for focused follow-up using validated qPCR primers, pathway-focused SignArrays® or customized gene expression panels.
Tell us about your data type, experimental design, biological question and the comparisons you want to investigate. Our scientific team can discuss an analysis strategy adapted to your dataset and determine whether targeted qPCR follow-up could complement the project.